Series 19: Compliance Systems vs. Recognition Systems Article 19D
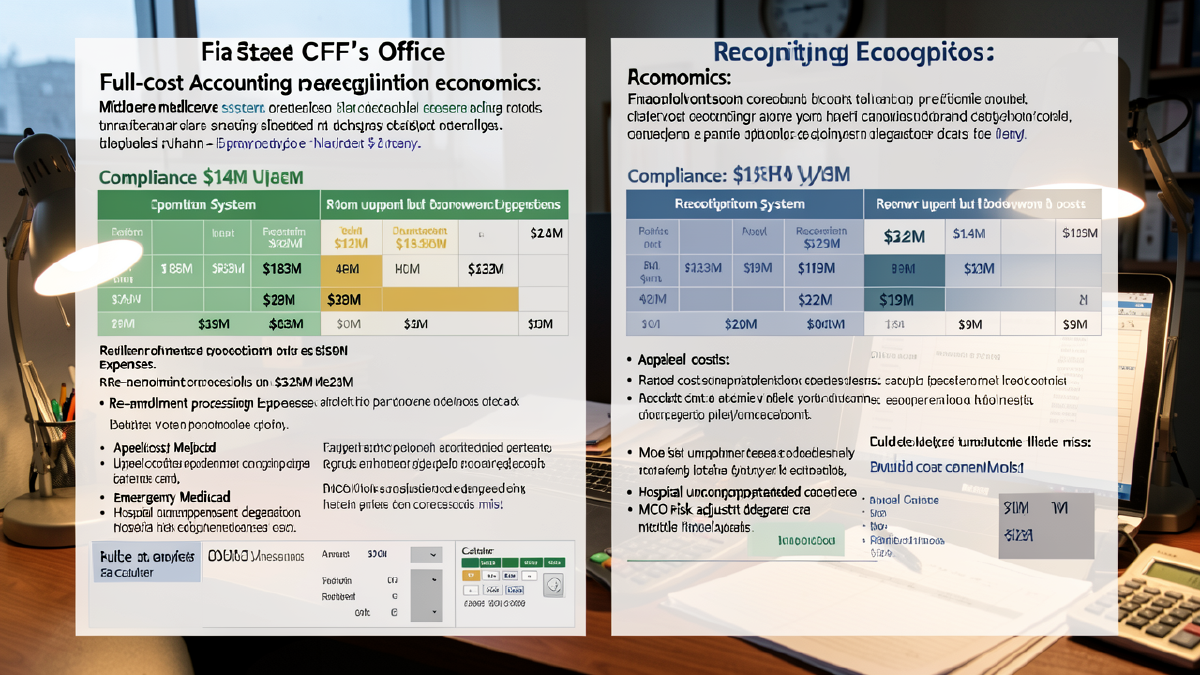
A state chief financial officer reviews two proposals for work requirement verification infrastructure. Vendor A offers a streamlined compliance system: an online portal with automated termination processing, basic phone support, and standard appeal procedures. Total cost: $14 million over three years. The proposal emphasizes efficiency, low per-transaction costs, and rapid implementation.
Vendor B offers recognition infrastructure: automated data matching against unemployment insurance, new hire, and cross-program databases, multi-channel verification including phone, mail, in-person, and text, a navigation workforce of 200 community health workers, provider attestation integration, and real-time compliance dashboards. Total cost: $32 million over three years. The proposal emphasizes accuracy, coverage retention, and downstream cost avoidance.
The CFO, facing a budget committee that measures fiscal responsibility by line-item expenditure, chooses Vendor A. The $18 million difference is real money. The state controller will note the savings approvingly.
Two years later, the state’s Medicaid program has terminated 78,000 expansion adults for non-compliance. Post-implementation analysis reveals that approximately 65,000 of them were working or qualified for exemptions. Re-enrollment processing for the 45,000 who returned to coverage within six months cost $23 million. Fair hearing and appeals processing for 12,000 contested terminations cost $8 million. Emergency Medicaid for coverage gaps cost $15 million. Hospitals absorbed $42 million in uncompensated care for terminated members who showed up in emergency departments with conditions that Medicaid would have covered. MCOs lost an estimated $95 million in risk adjustment degradation as returning members carried depleted health risk scores.
The neighboring state, which chose Vendor B’s recognition infrastructure, spent $32 million total. It terminated 9,000 people, the vast majority of whom were genuinely non-compliant. It processed 3,000 re-enrollments at $1.6 million. It handled 1,500 appeals at $1 million. Its hospitals absorbed $4 million in related uncompensated care. Its MCOs experienced $12 million in risk adjustment degradation.
The compliance system cost $14 million to build and generated $183 million in downstream costs. The recognition system cost $32 million to build and generated $19 million in downstream costs. The “cheaper” system cost $197 million. The “expensive” system cost $51 million.
This is not a close call. But it requires full-cost accounting to see it. And full-cost accounting is precisely what state budget processes are designed to prevent.
The Visible Costs of Recognition#
Recognition infrastructure costs real money, and those costs appear on specific budget lines that draw scrutiny during appropriation processes. Transparency about these costs is essential to an honest economic argument. Advocates who pretend recognition is cheap undermine their credibility. Recognition is not cheap. It is cheaper than the alternative.
Data matching infrastructure requires investment in secure data transfer systems, identifier matching algorithms, inter-agency agreements, and ongoing maintenance. States that lack modern eligibility systems may need substantial upgrades to process automated verification at scale. The federal government provides 90/10 matching for Medicaid system modernization, meaning states pay only 10 cents of every dollar invested, but even the state share represents a visible appropriation.
Multi-channel verification operations require staffing, training, and infrastructure for phone centers, mail processing, in-person verification sites, and text-based systems. Each channel has fixed costs (infrastructure, technology, training) and variable costs (per-transaction processing). Operating five channels costs more than operating one. This is mathematically undeniable and politically salient.
Navigation workforce investment, community health workers, navigators, and call center staff who assist members with verification, represents the largest visible line item in recognition budgets. A state employing 200 navigators at an average fully loaded cost of $55,000 per navigator spends $11 million annually on a workforce that compliance systems do not require. This expenditure appears in state budgets as a new cost, inviting questions from legislators who see it as spending money to help people keep benefits rather than spending money to verify eligibility.
Provider attestation payments add another visible cost. If a state pays $35 per attestation and processes 100,000 medical exemption attestations, the cost is $3.5 million. Under compliance systems, providers complete exemption documentation without state payment, meaning the cost is borne by providers rather than state budgets. The shift from invisible provider cost to visible state cost creates political resistance even though the total system cost is lower.
System integration and maintenance represents an ongoing expense that compliance systems also incur but at lower levels. Recognition systems require integration across more data sources, more channels, and more partners, creating higher maintenance costs and more complex system administration.
These costs are visible, quantifiable, and attributable to specific budget lines. They appear in legislative appropriation requests. They draw scrutiny from budget committees. They create political vulnerability for Medicaid directors who must defend them against the obvious question: “Why are you spending $32 million when you could spend $14 million?”
The answer requires accounting for costs that the appropriations process systematically ignores.
The Hidden Costs of Compliance#
Compliance systems appear cheaper because their costs are distributed across budgets, agencies, time horizons, and stakeholders in ways that make them invisible to the decision-makers choosing between systems.
Re-enrollment processing for wrongly terminated members represents the most direct hidden cost. When a working person loses Medicaid coverage because they failed to submit verification, many will re-enroll within months once they understand what happened or when their next redetermination period arrives. Each re-enrollment requires application processing, eligibility verification, plan selection, and provider network assignment. States estimate processing costs of $400 to $600 per re-enrollment episode. A state that wrongly terminates 50,000 people and processes 35,000 re-enrollments within a year spends $14 to $21 million on administrative churn, processing people out of a program and back into the same program, accomplishing nothing except generating costs.
Appeals and fair hearing costs accumulate when terminated members contest their coverage loss. Each fair hearing requires scheduling, evidence review, adjudicator time, and decision processing. Costs per hearing range from $300 to $1,000 depending on complexity and state hearing infrastructure. States with high wrongful termination rates face thousands of hearings, creating backlogs that delay resolution and extend periods without coverage.
Emergency Medicaid for coverage gaps creates costs that appear in a different budget line than the verification system that generated them. When a terminated member arrives at an emergency department with a condition that would have been managed through primary care under continuous coverage, the state pays for emergency services at rates far exceeding what preventive or maintenance care would have cost. A diabetic who loses coverage and develops ketoacidosis generates a $15,000 to $25,000 emergency hospitalization that continuous coverage and $200 monthly medication would have prevented.
Uncompensated care shifted to hospitals represents a cost that exits the Medicaid budget entirely and lands on hospital financial statements, state uncompensated care pools, and ultimately on other payers through cost-shifting. When terminated Medicaid members seek care they cannot pay for, hospitals absorb the loss. Safety-net hospitals in communities with high expansion enrollment face particularly acute financial pressure. These costs are real, measurable, and directly attributable to wrongful terminations, but they never appear in the budget analysis comparing verification systems because they appear in a different entity’s budget.
Risk adjustment degradation for MCOs represents the single largest hidden cost of compliance-oriented systems and operates through a mechanism that most state budget processes do not account for at all. When a member loses coverage, stops receiving care, and returns months later, their health risk score, the basis for MCO capitation payments, no longer reflects their actual clinical needs. A member with diabetes, hypertension, depression, and chronic kidney disease carries a risk score reflecting four to six documented chronic conditions. After a six-month coverage gap during which no conditions were documented through claims encounters, the member returns with a risk score reflecting perhaps one or two conditions. The MCO receives capitation payment appropriate for a relatively healthy member while inheriting a member whose actual healthcare costs reflect severe, now poorly managed, chronic disease.
The financial magnitude of risk adjustment degradation is extraordinary. Analysis of MCO financial exposure estimates that a complex member returning from a six-month coverage gap generates $5,000 to $8,000 in underpayment over the twelve to eighteen months required to rebuild their risk score through new clinical documentation. The top 15 percent of members by clinical complexity generate 60 to 70 percent of total risk adjustment degradation exposure. Across a state’s entire expansion population, aggregate risk adjustment degradation from compliance-driven terminations can reach hundreds of millions of dollars annually.
Care management investment loss affects both MCOs and Accountable Care Organizations. When a plan or provider organization invests in managing a member’s chronic conditions, building medication adherence, coordinating specialists, and providing social support, and that member loses coverage due to verification failure, the investment is lost. The member returns months later with conditions that have deteriorated, requiring new investment in stabilization before the care management trajectory can resume. This cycle of invest, lose, reinvest destroys value that would have been preserved under continuous coverage.
Quality measure disruption and quality withhold losses represent another hidden cost channel. MCO contracts increasingly include quality performance measures tied to financial withholds. When members churn through coverage gaps, quality metrics become unreliable. A diabetic patient’s A1C measurement is meaningless if the patient lost coverage for four months and did not have access to insulin. Disrupted quality measures can cost MCOs millions in withheld performance payments.
The critical insight is that each of these hidden costs appears in a different budget, on a different timeline, and under a different decision-maker’s authority. Re-enrollment costs appear in the eligibility agency’s operating budget. Appeals costs appear in the hearing office budget. Emergency Medicaid appears in the fee-for-service claims budget. Uncompensated care appears in hospital financial statements. Risk adjustment degradation appears in MCO actuarial analyses. Quality withhold losses appear in MCO contract settlements. No single decision-maker sees the total. No single budget reflects the aggregate cost. The system that generates these costs, the compliance verification infrastructure, appears cheap precisely because the costs it generates are invisible to the people evaluating it.
The MCO Business Case#
Managed care organizations have perhaps the clearest business case for recognition investment, because the costs of compliance-driven terminations flow directly to MCO bottom lines through mechanisms that conventional margin analysis dramatically understates.
The conventional calculation of MCO financial exposure from coverage loss follows simple logic: identify members lost, multiply by average premium, apply margin percentage. This approach suggests modest financial impact because Medicaid managed care margins average 2 to 3 percent. Losing a member generating $5,000 in annual premium at a 3 percent margin means losing $150 in annual profit. At this math, even substantial coverage losses appear manageable.
But this calculation misses the categories of loss that do not follow margin mathematics. Risk adjustment degradation operates through a completely different mechanism than premium loss. When a complex member cycles through a coverage gap and returns, the MCO does not lose margin on premium. It receives premium that is systematically inadequate for the actual costs of serving a returning member whose risk score has degraded. The gap between the degraded capitation payment and actual healthcare costs represents a direct loss that can reach $5,000 to $8,000 per complex returning member over a twelve to eighteen month restabilization period.
Navigation investment of $400 to $500 per member to prevent coverage loss delivers extraordinary returns when measured against the alternative. For a complex member with multiple chronic conditions, $400 in navigation costs prevents $5,000 to $8,000 in risk adjustment degradation, a return on investment of 10:1 to 20:1. Even for less complex members, navigation investment returns multiples of its cost by preventing administrative churn and its associated processing expenses.
The healthy member paradox adds another dimension. Healthy, low-utilization members generate margins of 40 to 60 percent because their premium substantially exceeds their healthcare costs. These members are also the most likely to lose coverage for compliance reasons because they lack the medical conditions that would qualify them for exemption. Losing a healthy member does not cost 3 percent of premium. It costs the full margin contribution of that member, which may exceed 50 percent of premium. Compliance systems that terminate healthy working members destroy the profitable enrollment that cross-subsidizes care for sicker members.
MCO self-interest aligns with recognition investment when the full financial picture is visible. An MCO that invests $5 million in navigation and recognition infrastructure to prevent 15,000 wrongful terminations avoids an estimated $60 to $90 million in combined risk adjustment degradation, healthy member margin loss, and quality withhold exposure. The investment is not charitable. It is among the highest-return investments an MCO can make.
Contract structures that incentivize recognition can amplify this alignment. States that include coverage retention metrics in MCO contract performance standards, that share savings from reduced administrative churn, and that provide rate-setting credit for recognition infrastructure investment create contractual frameworks where MCOs profit from keeping working people covered rather than processing their termination.
The State Fiscal Case#
States face their own fiscal calculus that extends beyond Medicaid program budgets. The 90 percent Federal Medical Assistance Percentage for expansion adults means that for every dollar of Medicaid spending on this population, the federal government pays 90 cents. When expansion adults lose coverage and shift to state-funded safety net services, the state replaces 10-cent dollars with 100-cent dollars.
A member receiving Medicaid coverage costs the state approximately $500 annually in state share (10 percent of $5,000 average annual cost). If that member loses Medicaid and seeks care through state-funded charity care programs, county health systems, or emergency departments with state-supported uncompensated care pools, the state pays a far larger share. Emergency department visits that would have been covered at 10-cent federal dollars become 100-cent state and local dollars. Behavioral health crises that Medicaid would have addressed through outpatient treatment become 100-cent state dollars when they result in psychiatric emergency holds, involuntary commitments, or incarceration.
The corrections system absorbs costs when coverage loss destabilizes vulnerable populations. Research consistently links Medicaid coverage to reduced criminal justice involvement, particularly for populations with mental illness and substance use disorders. When coverage loss interrupts mental health treatment or medication-assisted treatment for opioid use disorder, the probability of crisis events, including events that involve law enforcement, increases. Jail and prison costs far exceed the state share of Medicaid coverage for the same individuals.
Long-term fiscal modeling beyond the annual budget cycle reveals the compounding nature of compliance system costs. A person who loses coverage in Year 1, develops unmanaged chronic disease complications during the coverage gap, and returns to Medicaid in Year 2 with higher acuity generates permanently elevated costs. The diabetes that was controlled at $200 per month in medication costs becomes uncontrolled diabetes with kidney complications costing $5,000 per month in dialysis. The state’s 10 percent share of those elevated costs continues indefinitely. The coverage gap that lasted six months generates cost consequences that persist for years.
State budget processes, which operate on annual or biennial cycles, systematically undercount these long-term costs. The appropriation that funds verification infrastructure in Year 1 is evaluated against the costs visible in Year 1. The downstream costs that materialize in Years 2 through 10 are attributed to healthcare cost growth, chronic disease prevalence, or other factors rather than to the verification system design that generated them.
Investment Allocation Framework#
Given finite resources, states must prioritize recognition investments by expected return. Not all recognition components deliver equal value per dollar invested. An allocation framework based on cost-per-false-negative-prevented provides guidance.
Data matching represents the highest-return investment. The marginal cost of verifying one additional member through automated data matching is near zero once the infrastructure exists. Data sharing agreements, system interfaces, and matching algorithms require upfront investment but can verify hundreds of thousands of members at minimal per-transaction cost. A $5 million investment in data matching infrastructure that automatically verifies 400,000 members costs $12.50 per verified member. No other recognition component approaches this cost-effectiveness.
Navigation investment for high-complexity populations delivers the next highest return. Concentrating navigator resources on the top 15 percent of members by clinical complexity, where risk adjustment degradation exposure is greatest, produces the largest financial return per navigator dollar spent. A navigator helping a complex member with four chronic conditions maintain coverage prevents $5,000 to $8,000 in downstream costs. The same navigator helping a healthy member with straightforward employment documentation prevents perhaps $500 in downstream costs. Stratifying navigation investment by member complexity maximizes return.
Multi-channel verification functions as insurance against single-point failures. Each additional channel catches members who would have been missed by existing channels. The marginal value of the fifth channel is lower than the marginal value of the second channel, but even the fifth channel prevents some terminations that would otherwise occur. The cost of maintaining channels should be evaluated against the cost of terminations those channels prevent, with diminishing returns recognized at the margin.
Provider attestation infrastructure delivers concentrated return in the exemption population. The cost of building attestation pathways, EHR integration, provider payment, is modest relative to the number of exemptions captured. Each captured exemption prevents a wrongful termination that would generate re-enrollment costs, potential appeals, and coverage gap consequences.
The sequencing of investment should follow this return profile. Data matching first, because it delivers the most recognition at the lowest cost. Navigation for complex populations second, because it prevents the most expensive downstream costs. Multi-channel verification third, because it captures populations data matching misses. Provider attestation fourth, because it addresses the exemption population specifically.
The Accounting That Matters#
Recognition costs more upfront and less overall. Compliance costs less upfront and more overall. This is not a close call when full-cost accounting is applied. The difficulty is that state budget processes, legislative appropriation procedures, and political accountability mechanisms all operate on partial accounting that makes the cheaper-looking option appear fiscally responsible and the more expensive-looking option appear wasteful.
Shifting this dynamic requires transparency about total costs across budgets, time horizons, and stakeholders. It requires Medicaid directors who can present full-cost analyses to budget committees. It requires MCO executives who can quantify risk adjustment degradation in terms that actuaries and regulators understand. It requires hospital systems that can trace uncompensated care costs back to verification system design. It requires legislators willing to evaluate verification investments against downstream costs rather than against each other.
The accounting that favors compliance is incomplete accounting. Full-cost analysis, across budgets and time horizons, makes the recognition case overwhelming. The question is whether decision-makers will perform that analysis or continue making choices based on the visible numerator while ignoring the invisible denominator.