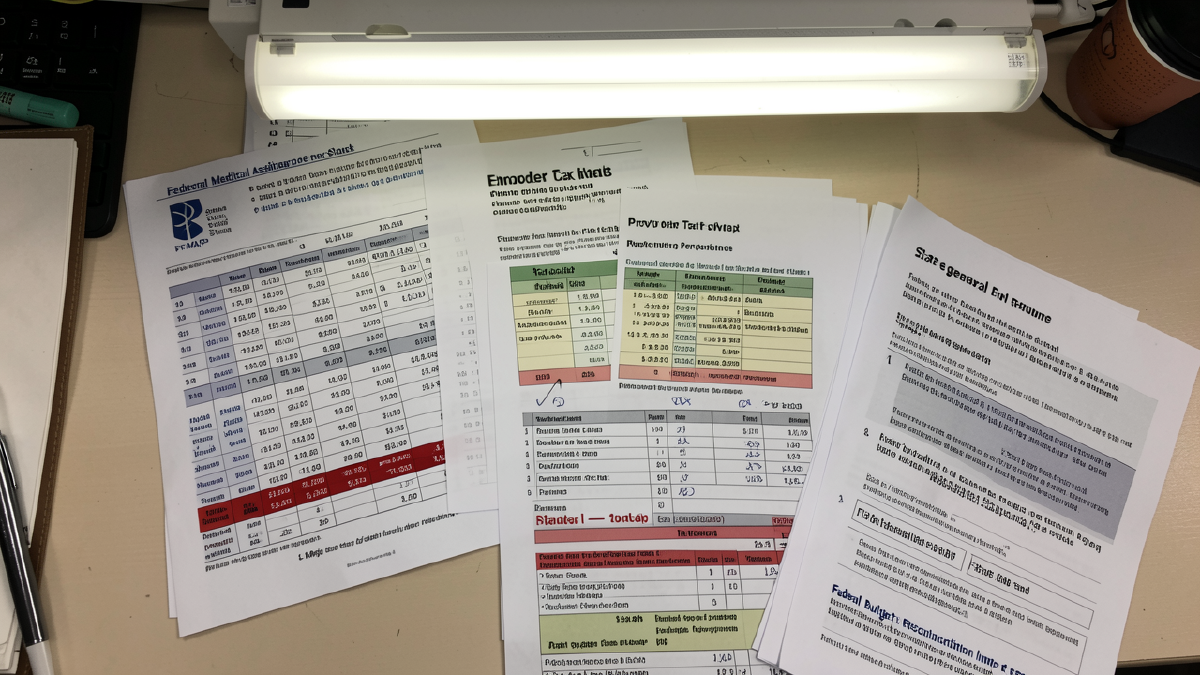
The Federal Medical Assistance Percentage determines federal contributions to state Medicaid expenditures through an open-ended entitlement where federal payments increase proportionally with state spending. The formula compares state per capita income to national per capita income, producing matching rates ranging from the 50 percent floor in wealthiest states to the 77.76 percent ceiling in Mississippi. Fourteen states receive the minimum 50 percent match, paying dollar-for-dollar with federal contributions for every Medicaid expenditure, while Mississippi receives 77.76 percent meaning the state pays only 22.24 cents for every dollar of Medicaid spending. Work requirements implementation occurs within this financing architecture that creates divergent investment incentives across states, with Mississippi generating $3.49 in federal match for services to retained members for every dollar spent on navigation infrastructure while New York generates only $1.00, fundamentally shaping strategic calculations about retention investment.
The Affordable Care Act offered states 100 percent federal funding for expansion populations through 2016, declining to 95 percent in 2017, 94 percent in 2018, 93 percent in 2019, and settling permanently at 90 percent from 2020 forward. This represented a historic federal financing commitment enabling states to extend coverage to adults up to 138 percent of the federal poverty level while bearing only 10 percent of medical costs. OB3 fundamentally alters this compact. The law eliminates the 90 percent enhanced match for expansion adults effective January 1, 2029, with federal participation transitioning to 80 percent through 2032 before returning to standard FMAP thereafter. The fiscal trajectory varies dramatically by state. Kentucky with FMAP 72.85 percent will see its state share for every $1,000 in expansion medical spending increase from $100 under the 90 percent match to $200 under the 80 percent transition to $271.50 under standard FMAP, nearly tripling state costs for the same population over six years. Ohio with FMAP 63.12 percent faces increases from $100 to $200 to $368.80. Floor states like New York see costs rise from $100 to $200 to $500.
Standard administrative activities receive 50 percent federal match regardless of state FMAP. Work requirement verification, exemption processing, compliance monitoring, and member outreach fall within this category, requiring states to fund half of all administrative infrastructure from state sources regardless of their economic circumstances or medical matching rates. This creates a structural paradox where Mississippi’s 77.76 percent medical FMAP reflects its limited fiscal capacity, but its administrative FMAP drops to 50 percent for building verification portals and hiring eligibility workers. Enhanced match exceptions exist for technology investments, with CMS regulations allowing 90 percent federal match for Medicaid information technology development and 75 percent for ongoing operations, meaning verification systems, data exchange platforms, member portals, and case management systems with health IT components could qualify. The critical limitation: enhanced HIT match covers technology but not human infrastructure. Navigation staff, community partnerships, exemption clinics, provider engagement, and care coordination cannot be classified as health information technology. These human components often represent larger cost categories than technology.
OB3 created a $50 billion Rural Health Transformation Program operating over ten years through the Hospital Insurance Trust Fund, providing competitive grants to rural hospitals, critical access hospitals, Federally Qualified Health Centers, and rural health clinics for infrastructure investment. However, the program cannot fund state Medicaid administrative costs, arrives too late for December 2026 implementation, and creates coordination challenges when federal rural health investments conflict with state work requirement implementation timelines. The program funds infrastructure without addressing the state matching funds required to leverage federal Medicaid dollars.
Provider tax restrictions represent the most significant OB3 financing constraint. Thirty-eight states currently employ provider taxes generating approximately $48 billion annually in combined state and federal Medicaid funding. These taxes enable states to generate state matching funds that draw down federal contributions without general fund appropriations. OB3 prohibits creation of new provider taxes and caps existing taxes at their current levels indexed only for medical inflation, preventing states from increasing rates to fund work requirements implementation costs. The Congressional Budget Office projects this restriction will reduce federal Medicaid spending by $141 billion over ten years, but states face the mirror image: loss of capacity to generate matching funds for infrastructure investment.
High provider tax utilizers face disproportionate implementation constraints. Illinois generates approximately $5.3 billion annually through provider taxes representing roughly 35 percent of state Medicaid matching funds. The state serves approximately 600,000 expansion adults requiring work requirement compliance infrastructure. Provider tax freezes eliminate the financing mechanism that would have funded navigation programs and exemption processing systems. New York raises approximately $11.8 billion through provider taxes, representing roughly 40 percent of state matching funds, serving approximately 2.1 million expansion adults with provider tax constraints forcing general fund appropriations or program reductions precisely when implementation demands increased spending. Michigan serves approximately 750,000 expansion adults with the provider tax freeze compounded by modest fiscal reserves and legacy eligibility systems built in the 1990s requiring modernization that budget constraints may prevent, potentially implementing work requirements with inadequate infrastructure not from policy choice but from fiscal inability to build anything better.
States facing provider tax constraints have explored alternatives though none fully replaces lost capacity. General fund appropriations require legislative action in tight budget environments, with states with divided government or resistant legislatures finding appropriations politically impossible regardless of implementation need. Reallocation from other Medicaid spending triggers provider opposition, as cutting hospital rates to fund navigation infrastructure creates political backlash from provider associations while reducing optional benefits creates coverage gaps that may harm members work requirements claim to help. MCO capitation increases can shift navigation costs from state administrative budgets to managed care contracts with MCO expenditures flowing through capitation rates that include federal match, but states requesting significant capitation increases face federal scrutiny about actuarial soundness with CMS requiring rate certifications reflecting legitimate cost increases rather than financing mechanisms. Community benefit obligations for nonprofit hospitals create potential partnerships where tax-exempt hospitals must demonstrate community benefit to maintain 501(c)(3) status, with navigation assistance helping community members maintain health coverage qualifying as community benefit activity enabling hospitals to fund navigation programs serving both community benefit requirements and hospital revenue protection through maintained patient coverage.
Federal policy created this financing crisis but provides no federal solution. Congress imposed work requirements knowing states would need infrastructure to implement them, simultaneously restricted the financing mechanism states traditionally used for such infrastructure, and provided no alternative dedicated funding for implementation. The federal government mandates the requirement, constrains financing tools, and offers only standard administrative match. If states fail to build adequate navigation infrastructure and coverage losses exceed policy intent, accountability remains unclear when states had insufficient resources and federal law prevented them from accessing their traditional financing mechanism. The Congressional Budget Office projects work requirements will save the federal government $326 billion over ten years, but states must bear implementation costs without dedicated federal support.
The provider tax restriction guarantees suboptimal implementation across many states. The question is not whether infrastructure will be adequate but how inadequate it will be and where coverage losses concentrate. States with strong fiscal positions, political will, and administrative capacity will build reasonable systems. States lacking any of these elements will struggle. The federal mandate is uniform, federal support is uneven, and implementation outcomes will diverge accordingly. Fee-for-service states face particular vulnerability because they cannot delegate implementation costs to MCOs. High-provider-tax states face disruption of their traditional financing mechanisms. Floor-FMAP states face the highest state share requirements. Rural states face infrastructure costs distributed across sparse populations.
The fiscal architecture creates a trajectory toward increasing state burden regardless of short-term implementation success. Enhanced expansion matches phase to standard FMAP by 2032 or shortly thereafter, with states that expanded expecting permanent 90 percent federal participation facing permanently higher state costs. The 10 percent state share that made expansion financially attractive becomes 20 percent to 50 percent depending on state FMAP. The current configuration reflects 2025 political alignment with nothing about the fiscal architecture permanent except the pattern of federal promises made and subsequently modified. The fiscal foundation shapes everything built upon it, with work requirement success or failure depending partly on verification system design, exemption policies, and navigation infrastructure, but fundamentally on whether states have resources to build and operate these systems at scale.