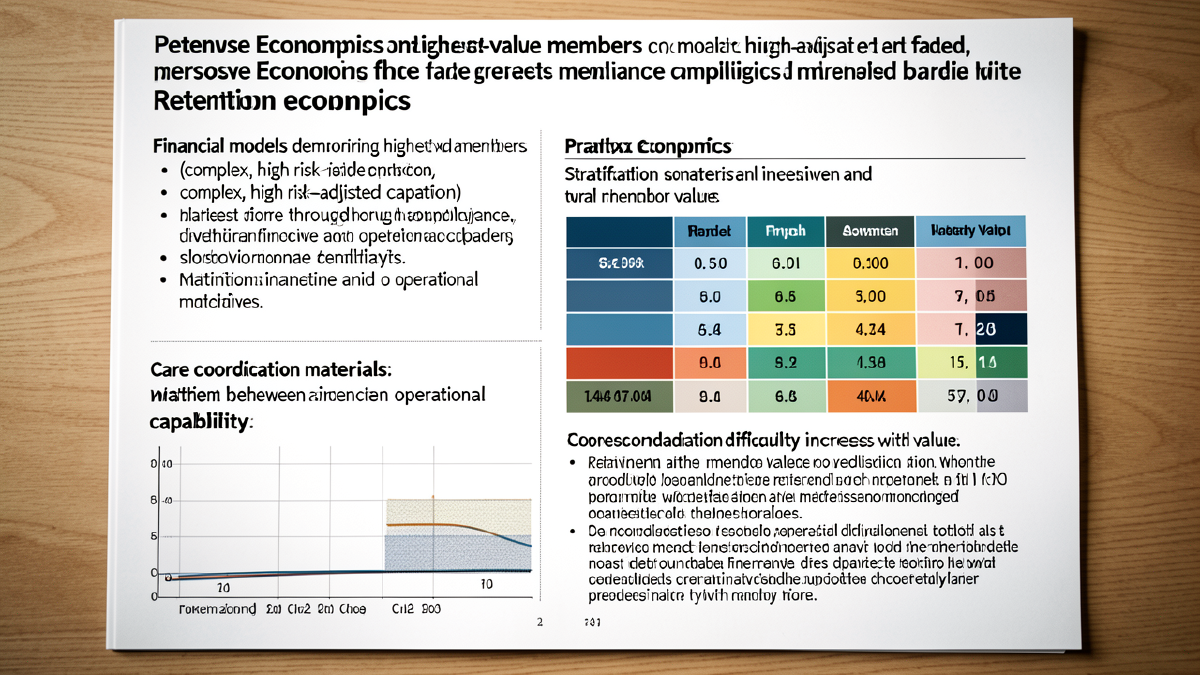
The MCO’s chief medical officer and chief financial officer sit across from each other with a spreadsheet between them. The CMO has just finished presenting her proposed navigation investment strategy: $4.2 million annually to support high-complexity members at risk of losing coverage due to work requirement documentation failures. The CFO’s initial response is predictable: “We’re going to spend how much to keep our most expensive members?”
Then she looks at the actuarial analysis her team prepared. A member with serious mental illness, diabetes, and hypertension generates $870 per month in risk-adjusted capitation. That same member, if they lose coverage for six months and return, might generate only $450 in capitation for 12-18 months while requiring $1,100 monthly in actual care costs during the recapture period. The loss of one such member for six months, followed by their return with worse health status, costs the MCO roughly $3,400 in the first year alone.
The navigation investment the CMO proposes would cost $480 per member. The alternative is to let documentation failures happen and absorb the consequences. The CFO’s initial objection dissolves as she recognizes the actual question: are we willing to spend $480 to avoid losing $3,400? The math is not subtle. But it runs counter to healthcare finance instincts that have always treated high-cost members as liabilities rather than assets.
The retention paradox is this: the members who cost the most to serve are often the ones you cannot afford to lose.
Understanding Risk Adjustment Mechanics#
To understand why losing complex members is financially catastrophic, one must first understand how Medicaid managed care payment systems work. MCOs do not receive flat per-member payments. They receive risk-adjusted capitation that attempts to match payment to expected costs based on documented health conditions.
A healthy 28-year-old with no chronic conditions might generate $380 monthly in capitation. A 52-year-old with diabetes generates perhaps $520. Add hypertension and it becomes $630. Add depression and it reaches $740. Add chronic kidney disease and it approaches $890. Each documented condition increments the risk score, which increments the capitation payment, because each condition implies higher expected costs.
This risk adjustment uses hierarchical condition categories that capture the presence and severity of chronic and acute conditions. The categories are hierarchical because more severe versions of conditions supersede less severe ones. Someone with advanced kidney disease receives a higher increment than someone with early stage kidney disease; the categories do not stack but rather select the highest applicable severity.
The critical detail is that risk scores are calculated from diagnosis codes submitted during healthcare encounters over a lookback period. In most state Medicaid programs, this lookback covers 12-24 months. Every physician visit, hospital stay, or outpatient procedure where a diagnosis code is recorded contributes to the risk score calculation. The more complete the documentation, the higher the risk score, and the higher the capitation payment.
For an MCO, this creates a perpetual documentation challenge. Medical records might note that a patient has diabetes, but if the physician does not include the diabetes diagnosis code on every relevant encounter, that encounter does not contribute to risk score calculation. MCOs invest substantially in provider education, medical record review, and documentation improvement because incomplete coding means underpayment.
The system works tolerably well under stable enrollment. A member with diabetes sees their primary care physician quarterly, generates four encounters annually with diabetes coding, and their risk score reflects their actual health status. The MCO receives appropriate payment and can plan care management interventions with reasonable confidence about costs and revenues.
Work requirements break this stability in two ways: they cause coverage gaps that interrupt documentation, and they create recapture lags that systematically underpay MCOs for returning members with degraded health status.
The Coverage Gap Documentation Problem#
When a member loses Medicaid coverage, they typically stop receiving routine healthcare. They cannot afford physician visits or specialist follow-ups without insurance. They may continue emergency department use for acute problems, but emergency visits generate narrow documentation focused on presenting complaints. The diabetic patient who visits the emergency department for chest pain gets documentation of chest pain workup; the diabetes, hypertension, and depression that a primary care physician would have documented go unnoted.
Six months without primary care means six months without documentation of chronic conditions. The member’s health status does not change. The diabetes remains. The hypertension remains. The depression remains, possibly worsening without treatment. But the documentation stream that feeds risk score calculation stops flowing.
When that member returns to Medicaid coverage after successfully navigating work requirement redetermination, they return to an MCO that receives capitation based on a risk score calculated from old data. If the lookback period is 12 months, and the member was uninsured for six months, half the data in the risk score calculation reflects a period when they were not receiving care and generating documentation. Their risk score degrades not because they became healthier, but because the measurement system stopped capturing their actual health status.
This creates a fundamental mismatch: the MCO receives payment for a member whose documented risk score reflects partial data from periods of care plus gaps without documentation, while serving a member whose actual health status likely worsened during the coverage gap. The diabetic patient who could not afford medication for six months returns with an A1C of 11, microalbuminuria indicating kidney damage, and early retinopathy. The treatment costs are immediate and substantial. The payment based on degraded risk scores lags by 12-24 months.
The member with serious mental illness who lost coverage while employed but unable to prove it faces even steeper consequences. Psychiatric medication interruption often triggers relapse. Hospital readmission rates for individuals with serious mental illness who lose coverage can exceed 40% within six months. An MCO inheriting such a member receives capitation based on historical risk scores that do not reflect acute decompensation, while immediately incurring costs for crisis stabilization, medication reinitiation, and care coordination.
The Hierarchical Condition Category Recapture Lag#
The financial damage from coverage gaps extends well beyond the immediate period of interrupted care. It persists through what actuaries call the recapture lag: the time required to rebuild documentation sufficient to restore appropriate risk-adjusted payment.
Consider a member with diabetes, hypertension, depression, and early chronic kidney disease who loses coverage for six months. Their pre-gap risk score might generate $870 monthly capitation. During the six month gap, they generate zero capitation because they are not enrolled. When they return, their risk score degrades to perhaps $450 monthly because half the lookback period reflects months without documented encounters.
But their actual care costs upon return likely exceed their pre-gap costs. Medication non-adherence during the gap means their diabetes is uncontrolled, their blood pressure elevated, their kidney function declined. Initial care upon return requires intensive management: medication adjustments, frequent monitoring, specialist referrals, possibly hospitalization for acute complications. Actual costs might run $1,100 monthly while the MCO receives $450.
This underpayment persists until new documentation accumulates to recapture the lost HCC codes. If the MCO’s primary care network sees patients quarterly, it takes 12 months of consistent care to generate four encounters documenting chronic conditions. During those 12 months, the MCO is systematically underpaid by $420 monthly, or roughly $5,000 total, relative to what appropriate risk adjustment would provide.
In aggregate, if an MCO with 500,000 expansion adults experiences a 15% coverage loss rate at each semi-annual redetermination, and half of those losses involve members with above-average complexity, the HCC recapture lag costs run into tens of millions of dollars annually. A plan losing 37,500 members semi-annually, with 18,750 being complex cases, faces aggregate underpayment during recapture periods that can approach $40-60 million annually once the pattern stabilizes.
These are not theoretical projections. Arkansas MCOs reported precisely this pattern during their 2018-2019 work requirement implementation. The plans lost substantial revenue from coverage terminations, then experienced acute cost pressure when terminated members returned months later with degraded documentation but escalated care needs. The state’s capitation rate-setting process, which relied on historical data from stable enrollment periods, did not adequately account for this volatility. MCOs absorbed losses that threatened plan solvency.
The Navigation Investment Case#
Against this backdrop of risk adjustment degradation and recapture lag costs, navigation investment takes on different financial character. The conventional framing treats navigation as a cost: money spent to help members maintain coverage that they should be able to maintain themselves if requirements are reasonable. This framing ignores the alternative cost.
An MCO facing potential loss of a member generating $870 monthly due to documentation failure has several options. It can do nothing and accept the revenue loss plus the downstream costs if the member returns. It can invest in light-touch outreach hoping the member resolves documentation on their own. Or it can invest in intensive navigation ensuring documentation succeeds.
The cost of intensive navigation for complex cases runs approximately $400-500 per member based on the cost models developed in GroundGame.Health’s pricing analysis. This includes care coordinator time, community partner engagement, documentation support, appeals representation if needed, and technology infrastructure. For a member generating $870 monthly, this represents six weeks of capitation revenue.
The return on this investment appears in several forms. Most directly, it prevents the immediate revenue loss of coverage termination. A member who maintains continuous coverage generates 12 months of $870 capitation ($10,440 annually) rather than six months of $870 followed by six months of zero and then 12-18 months of degraded payments. The difference in revenue to the MCO over a two-year period can exceed $3,000 per member.
The return also appears in avoided cost escalation. The member who maintains coverage and consistent treatment keeps their diabetes controlled. The member who loses coverage and interrupts medication develops complications. The cost difference between stable maintenance and complication management easily runs $200-400 monthly. Multiply across 18 months of recapture lag and the cost avoidance from navigation approaches $3,600-7,200.
A more subtle return appears in care management effectiveness. MCOs invest substantially in care management programs for members with chronic conditions: disease management protocols, medication adherence support, care coordination across specialists. These programs generate returns over 12-24 month periods. Coverage interruption eliminates those returns while leaving the investment costs already incurred as sunk. Navigation that prevents coverage loss protects prior care management investments.
The business case is stark: spending $450 to prevent $3,000-6,000 in combined revenue loss and cost escalation generates returns of 6:1 to 13:1. Few healthcare interventions offer such clear return on investment. The puzzle is why MCOs have historically under-invested in retention.
Part of the answer is that traditional Medicaid enrollment was relatively stable. Annual redetermination cycles with presumptive eligibility created steady populations where retention investment was unnecessary. Work requirements transform that stability into volatility, suddenly making retention investment economically essential.
Part of the answer is also organizational structure. The departments that would manage navigation sit within care management or member services, operating under different budgets than finance and actuarial functions that absorb risk adjustment losses. The siloed structure prevents the connection between navigation spending and risk adjustment protection from driving resource allocation decisions.
Risk Stratification and Selective Investment#
The analysis above demonstrates that navigation investment pencils out clearly for high-complexity members with substantial risk-adjusted capitation. But expansion populations are not uniformly complex. The economic logic of retention investment varies considerably across member segments.
For members with minimal documented chronic conditions generating near-baseline capitation of $380-450 monthly, the risk adjustment protection argument weakens. A member generating $400 monthly who loses coverage for six months and returns with degraded risk scores might drop to $350 monthly, representing $600 in annual underpayment during recapture. If navigation for this member costs $450, the pure financial return is marginal at best.
This creates a strategic resource allocation challenge. MCOs with limited navigation budgets must target investment toward members where return on investment is highest. Risk stratification becomes essential: identifying which members have characteristics that predict both high baseline value and high retention benefit.
Several factors predict high retention value:
- Documented chronic conditions in multiple organ systems
- Behavioral health comorbidities, particularly serious mental illness
- Recent high-cost utilization suggesting disease progression
- Medication adherence challenges indicating management complexity
- Social determinants of health barriers documented in care management notes
- History of coverage interruptions suggesting documentation vulnerability
An MCO might stratify its expansion population into three tiers for navigation resource allocation:
Tier 1: High-Value Retention (15-20% of at-risk population) Members with risk scores above $750 monthly, typically indicating three or more chronic conditions with documented management complexity. These members receive intensive professional navigation costing $400-500. The return on investment runs 6:1 to 13:1 based on risk adjustment protection alone.
Tier 2: Moderate-Value Retention (25-35% of at-risk population) Members with risk scores of $500-750, typically indicating one or two chronic conditions with stable management. These members receive Community Inclusive Social Enterprise navigation costing $100-150. The return on investment runs 3:1 to 5:1, still highly favorable but not requiring professional-level resources.
Tier 3: Low-Complexity Routine (45-60% of at-risk population) Members with risk scores below $500, predominantly healthy expansion adults whose work documentation should be routine. These members receive automated outreach and self-service tools costing $15-25. The return on investment is modest but the low cost makes broad deployment sustainable.
This stratification allows MCOs to concentrate resources where financial returns are highest while still providing baseline support across the entire at-risk population. The key insight is that not all members are equally valuable to retain from a pure financial perspective, even though all members have equal moral claims to coverage.
Strategic Implications for MCO Leadership#
Recognition that complex members generate retention value transforms several strategic decisions that MCO executives face:
Rate Negotiation Strategy
State Medicaid agencies set capitation rates through actuarial processes that historically assumed stable enrollment. MCOs negotiating rates for contract periods that include work requirement implementation should insist on risk corridors that share volatility. The standard actuarial models will systematically underestimate costs if they do not account for HCC recapture lag.
MCOs should also push for rate-setting methodologies that calculate risk scores from shorter lookback periods during implementation years. If the lookback period remains 24 months while significant coverage disruption occurs, risk scores will lag reality by a full policy cycle. Shortening lookback to six or 12 months reduces this lag, though it creates other volatility.
Care Management Integration
Navigation for work requirement compliance should not be organizationally separate from care management for chronic conditions. The same complex members who need intensive disease management are the ones who need intensive documentation support. The departments should merge or at least closely coordinate, allowing care coordinators to address both clinical needs and administrative barriers in integrated member engagement.
This integration also allows better resource allocation. A care manager working with a diabetic patient on medication adherence can simultaneously address work requirement documentation, eliminating duplicative outreach and reducing member burden. The combined value of improved clinical outcomes and retained coverage justifies higher per-member spending than either function alone.
Provider Network Design
MCO provider networks should increasingly include navigation services as essential providers rather than optional add-ons. Community-based organizations with cultural competence and trust relationships should be contracted as critical infrastructure, with payments structured to ensure sustainability. The common MCO practice of treating community partners as peripheral vendors that can be defunded when budgets tighten becomes economically irrational when the downstream costs of coverage loss exceed community partner costs by 5:1 or 10:1.
Network adequacy standards that traditionally focused only on physician access should expand to include navigation access. An MCO serving populations with serious mental illness should demonstrate contracted capacity with peer-led community organizations that can provide culturally appropriate navigation support. State regulators reviewing network adequacy should evaluate this capacity alongside traditional provider ratios.
Technology Investment Priorities
MCO technology roadmaps should prioritize real-time risk score visibility and documentation gap identification. If an MCO does not know which members have high risk scores and incomplete recent documentation, it cannot target navigation resources effectively. The actuarial function’s risk adjustment analytics should feed member-level alerts that trigger care management intervention.
Technology should also support distributed documentation submission, allowing members to upload verification documents via mobile app, allowing community partners to submit on members’ behalf, and allowing providers to attest directly from EHR systems. The Arkansas experience demonstrated that barriers to documentation submission drive coverage loss among compliant members. Reducing these barriers generates direct return on investment through retained high-value members.
Special Populations Focus
The Series 11 populations merit particular attention because they concentrate multiple characteristics that predict both high risk scores and high documentation vulnerability. A member with serious mental illness, homeless, with diabetes faces enormous barriers to work requirement compliance. That same member likely generates $900-1,200 monthly capitation due to the combined HCC burden.
MCOs should develop specialized navigation protocols for these populations rather than treating them as edge cases. A navigation protocol for members with serious mental illness should integrate with psychiatric care teams. A protocol for homeless members should integrate with housing support services. The investment is substantial but the financial return from preventing coverage loss in these populations is extraordinary.
When Retention Investment Does Not Pencil Out#
The analysis above demonstrates that retention investment generates strong returns for complex high-cost members but weaker returns for healthy low-risk members. This creates an uncomfortable question: are there members where retention investment should not be pursued because the financial return is inadequate?
From a pure financial perspective, yes. A member generating $380 monthly capitation with no chronic conditions and no documented care needs in the past year has minimal risk adjustment value to protect. If that member faces work requirement documentation challenges requiring intensive navigation at $450, the financial return may be negative. The MCO spends more on navigation than it loses from coverage termination.
This financial logic runs directly against the mission logic that many MCOs, particularly those with safety-net roots, bring to Medicaid work. Every member has equal moral standing. Coverage is not a financial asset to be protected based on profitability calculations; it is a human right or at minimum a program entitlement that should not vary based on member profitability.
The tension is genuine and not easily resolved. MCOs are businesses that must maintain solvency. They cannot ignore financial returns indefinitely. But they also operate in a sector where mission matters and where purely profit-maximizing behavior generates public outrage and regulatory intervention.
Several considerations complicate the apparent conflict. First, members who appear low-risk based on current documentation may have undocumented conditions that would emerge with appropriate primary care. The apparently healthy member might have undiagnosed diabetes or depression. Losing coverage prevents that diagnosis, which prevents both appropriate care and appropriate risk adjustment. Retention preserves the option value of future diagnosis.
Second, today’s low-risk member may be tomorrow’s high-risk member. Chronic conditions develop over time. The 28-year-old with no documented conditions today might be the 32-year-old with diabetes in four years. Retention investment in low-risk members protects long-term population value, even if short-term return on investment is modest.
Third, risk scores are averages that mask individual variation. Some members with low aggregate risk scores have specific high-cost conditions that are poorly captured by HCC categories. Maternal health costs, which can exceed $10,000 per delivery, are not well reflected in risk scores. Retention investment that appears marginally justified on risk score analysis might be strongly justified on total cost of care analysis.
The practical resolution is that MCOs should allocate retention resources proportional to financial return while maintaining a floor of basic support for all members. High-value complex members receive intensive professional navigation. Moderate-complexity members receive CISE navigation. Low-complexity members receive automated outreach and self-service tools. No member receives zero support, but resource intensity matches financial justification.
Rate Negotiation and Shared Risk#
State Medicaid agencies setting capitation rates for periods that include work requirement implementation face profound actuarial uncertainty. Historical cost and utilization data come from periods of stable enrollment. The volatility that work requirements introduce has no precedent in recent state experience outside Arkansas and Kentucky.
Standard actuarial practice builds capitation rates from base period experience trended forward with adjustments for policy changes. This approach assumes that population characteristics remain relatively constant. If work requirements cause differential disenrollment where sicker members leave at higher rates, the remaining population becomes healthier and less costly. If work requirements cause churn where members cycle off and back on with documentation gaps, the returning population has degraded risk scores but escalated care needs.
The appropriate actuarial adjustment for work requirements is not obvious. States might reasonably expect that members who cannot comply with work requirements are on average healthier than those who automatically qualify for exemptions due to disability or medical conditions. This would suggest downward pressure on capitation rates. But the HCC recapture lag and the cost escalation from coverage interruption create upward pressure. The net effect is ambiguous and depends on patterns that will not be observable until implementation generates data.
MCOs facing this uncertainty have limited options. They can bid conservatively, building substantial margins into capitation rates to protect against adverse scenarios. But states will reject rates they view as padded. They can bid aggressively, assuming favorable scenarios, but this risks insolvency if reality proves worse. Or they can negotiate risk corridors that share uncertainty between MCO and state.
Risk corridors specify thresholds above and below expected costs where the state shares gains or losses. If actual costs come in 5% above projected, the state might reimburse the MCO for 75% of the excess. If costs come in 5% below projected, the MCO might refund 75% of the savings. This creates downside protection while preventing windfall profits.
For work requirement implementation, risk corridors are arguably essential. The uncertainty is too large for MCOs to price it fully into capitation bids without building in margins that states will view as unacceptable. Shared risk allows lower base rates while protecting both state and MCO from extreme outcomes.
The alternative is that MCOs price worst-case scenarios into their bids, states reject those bids as excessive, and markets wind up with fewer MCOs or MCOs that accepted rates they cannot sustain. Neither outcome serves members well. Risk corridors allow implementation to proceed while deferring the actuarial reckoning until data emerges.
The Counterargument: Retention as Subsidy#
Critics of aggressive retention investment might argue that helping members maintain Medicaid coverage despite work requirement non-compliance defeats the policy’s purpose. If work requirements exist to encourage employment and transition to self-sufficiency, navigation that enables people to stay on Medicaid without actually working undermines the goal.
This critique has force when navigation helps members game the system: documenting activities that technically meet requirements without reflecting genuine engagement. If navigation becomes a fig leaf allowing continued Medicaid enrollment for people who should be working but are not, it represents a coverage subsidy rather than a pathway to compliance.
The counter-response distinguishes types of navigation assistance. Navigation that helps members understand what activities count, identify opportunities that fit their circumstances, and document genuine compliance serves the policy’s goals. Navigation that helps members fabricate compliance or submit documentation of activities they did not actually perform subverts the policy.
The empirical question is what proportion of navigation falls into each category. If most navigation addresses genuine documentation barriers facing compliant members, the retention investment serves both member interests and program integrity. If substantial navigation enables non-compliance to appear as compliance, the investment undermines program goals.
Evidence from Arkansas suggests most coverage losses occurred among members who were working or exempt but could not prove it. Documentation failure, not genuine non-compliance, drove most terminations. Navigation addressing documentation barriers would have prevented coverage loss among members already complying. This suggests retention investment serves compliance goals rather than subverting them.
For members genuinely unable to meet work requirements due to barriers that do not qualify for exemptions, navigation investment becomes more philosophically contested. Should MCOs invest in retaining coverage for someone who cannot work 80 hours monthly due to circumstances that the state has determined do not merit exemption? The financial analysis says yes; the retention value exceeds the navigation cost. The policy analysis is less clear.
The honest assessment is that retention investment will include both types: support that enables genuine compliance and support that preserves coverage for people who cannot comply but need coverage anyway. The balance between these depends on exemption policy generosity and documentation system design. Reasonable people can disagree about whether the mixture justifies the investment.
Conclusion: The Value Proposition Transformed#
The chief financial officer closes the business case presentation with a recommendation her board would have rejected as nonsensical five years ago: invest heavily in retaining the MCO’s most expensive members because they are also the most valuable. The board approves unanimously.
The transformation in thinking comes from recognizing that value in risk-adjusted capitation systems depends on documentation continuity. A complex member with continuous coverage generates appropriate risk-adjusted payment and allows care management programs to generate returns. The same member with coverage gaps generates revenue losses during gaps, documentation degradation upon return, recapture lag costs, and care escalation from treatment interruption.
The math is unambiguous for members with risk scores above $750 monthly. Navigation investment of $400-500 prevents losses of $3,000-6,000 over 18-24 months. The return on investment runs 6:1 to 13:1, comparable to the best care management programs. The puzzle is not whether to invest but why MCOs historically under-invested in retention.
The answer is that under stable enrollment regimes, retention investment was unnecessary. Annual redetermination with presumptive eligibility created populations that rarely churned off coverage. Work requirements create unprecedented semi-annual redetermination cycles with stringent verification requirements, transforming retention from automatic to precarious.
MCOs that recognize this transformation will reorganize their operational models, integrating navigation with care management, stratifying populations by retention value, and targeting resources accordingly. Those that treat navigation as peripheral charity rather than core business function will absorb HCC recapture losses that undermine financial performance for years.
State Medicaid agencies setting capitation rates must similarly recognize that historical cost patterns no longer predict future experience under work requirements. Rate-setting that ignores HCC recapture lag will systematically underpay MCOs, threatening plan solvency and market stability. Risk corridors that share volatility between state and MCO are not just financially prudent; they are arguably essential to functioning markets.
The retention paradox reveals a deeper truth about risk-adjusted payment systems: they reward documentation continuity as much as they reward health status. A complex patient whose conditions are thoroughly documented generates higher payment than an equally complex patient whose conditions are incompletely captured. Coverage volatility that interrupts documentation destroys value that has nothing to do with actual health status changes.
This insight transforms how MCO executives should think about work requirement implementation. The question is not whether to invest in retention. The question is how to invest strategically in retention where financial returns are highest, while maintaining floor levels of support for all members. High-value complex members merit intensive professional navigation. Moderate-complexity members merit CISE support. Even low-complexity members merit automated outreach and self-service tools.
What no member should receive is abandonment to documentation failure that causes coverage loss among people who are actually compliant or exempt. The financial cost to MCOs of such failures, multiplied across thousands of members, far exceeds the cost of preventing those failures through systematic navigation investment. The retention paradox is that your most difficult members are your most valuable, and losing them costs far more than retaining them.