The Broker Technology Gap: Still Mostly Excel, Email, and Carrier Portals
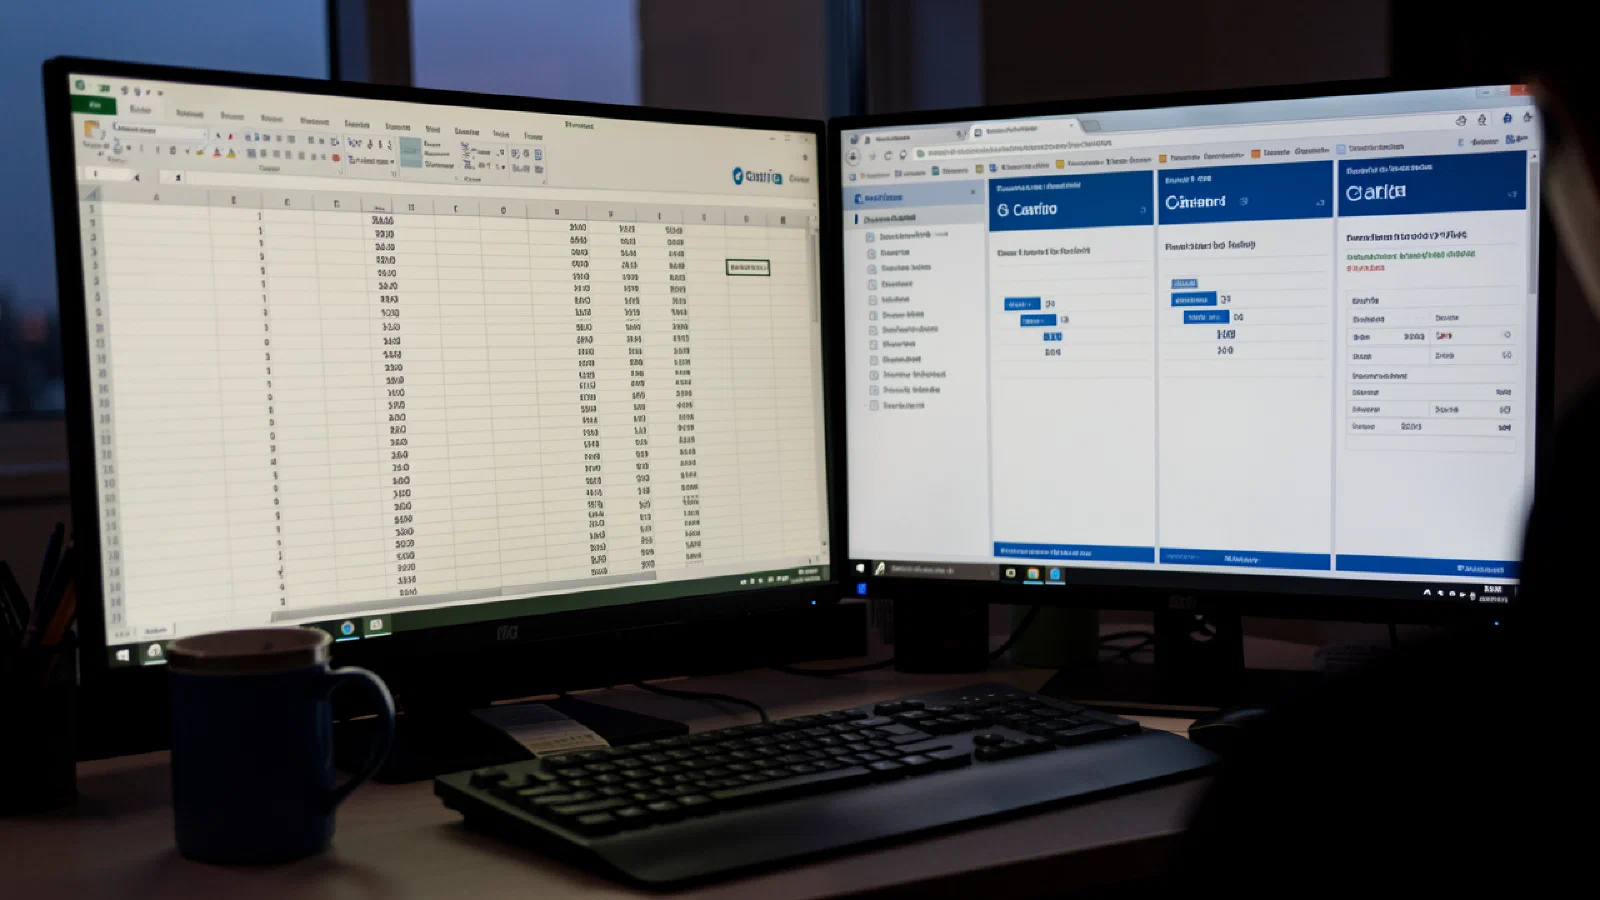
A broker preparing a level funded proposal for a 35-person employer opens three browser tabs. The first is the TPA’s quoting portal, where the broker submits a census file and receives a level funded quote showing the claims fund, stop loss premium, and administrative fee. The second is a carrier portal for a fully insured comparison quote. The third is a spreadsheet where the broker manually enters both quotes side by side, adding columns for projected surplus scenarios, stop loss terms, and net cost comparisons. The broker sends the completed spreadsheet to the employer as a PDF attached to an email.
This workflow describes the analytical infrastructure for a decision that will determine how a 35-person company manages its health care risk for the next 12 months. The spreadsheet is manual, error-prone, and dependent on the individual broker’s knowledge of what variables to include. The comparison reflects what the broker thinks matters, not what the data shows matters. The employer receives a static document, not an interactive analysis. There is no claims data modeling, no actuarial projection, no benchmarking against comparable employers. The broker’s technology stack for level funded advisory in 2026 is fundamentally the same stack brokers used for fully insured plan comparison in 2006.
What Brokers Actually Use#
The CRM layer tracks relationships, not analytics. AgencyBloc, HubSpot, Salesforce, and Benefitfocus serve as client management platforms for benefits brokers. AgencyBloc, the most broker-specific of these, reported record-breaking growth in 2024, with 8.8 million policies created and 7.7 million workflow events triggered across its customer base. These platforms track renewal dates, client contact information, policy details, and commission payments. They manage the broker’s book of business. They do not provide the analytical capability that level funded advisory requires. A broker using AgencyBloc can see that the 35-person logistics company’s renewal is in 90 days. The broker cannot see, within the CRM, the claims data analysis that should inform the renewal strategy.
Benefits administration platforms handle enrollment workflow. Employee Navigator and Ease (which Employee Navigator acquired in 2024, creating a combined platform with over 22 new carrier integrations) serve the small and mid-market broker channel. bswift, owned by CVS Health, serves larger groups. These platforms digitize the enrollment process: employee self-service portals, electronic forms, eligibility management, EDI carrier connections, and compliance documentation. They are the infrastructure that operationalizes the plan after the broker has placed it. They do not support the analytical work that precedes the placement decision. Employee Navigator does not model claims projections. Ease does not evaluate stop loss terms. bswift does not benchmark employer plan performance against comparable groups. The enrollment platform and the advisory platform are different tools serving different functions, and the advisory platform does not exist as a commercially available product for most brokers.
Carrier and TPA portals are siloed and incompatible. Each TPA and stop loss carrier provides its own portal for quoting, census submission, underwriting status, and reporting. A broker contracted with three TPAs and two stop loss carriers logs into five separate portals to gather the information needed for a single employer’s renewal analysis. The data from each portal arrives in a different format. Census templates differ. Quote presentations differ. Reporting structures differ. Comparison requires manual extraction and spreadsheet assembly. Nothing is standardized. Nothing is automated. The broker who manages 50 level funded accounts spends hours each week extracting data from portals and reassembling it in spreadsheets.
Email remains the primary communication channel. Quoting requests, underwriting questions, plan design discussions, stop loss negotiations, and renewal conversations all flow through email between the broker, the TPA, the stop loss carrier, and the employer. Nothing is structured. Nothing produces institutional knowledge. When the broker who managed a client relationship leaves the agency, the institutional memory of that relationship lives in an email archive, not in a system. The next broker inherits the client but not the history, the context, or the analytical work product.
Spreadsheets are the analytical engine. The broker builds a comparison showing fully insured and level funded options side by side. The spreadsheet includes premium or total cost, projected surplus scenarios (optimistic, expected, pessimistic), stop loss terms, plan design comparisons, and net cost calculations. The quality of the spreadsheet depends entirely on the individual broker’s actuarial literacy. A broker who understands aggregate corridors, specific attachment point selection trade-offs, and trend projection builds a more complete spreadsheet than a broker who compares only total monthly cost. But even the best spreadsheet is static, manual, and disconnected from the data sources that would inform its assumptions.
What Level Funded Advisory Actually Requires#
Claims data analysis is the foundation of informed level funded advisory. The broker evaluating whether to renew a level funded plan, or whether to recommend level funded for the first time, needs to analyze the employer’s claims history. This means identifying cost drivers (which members generate the highest claims, what conditions drive costs, what utilization patterns emerge), projecting future claims based on demographic trends and known conditions, and evaluating whether the level funded cost structure is favorable relative to the fully insured alternative given the specific group’s experience. This analysis requires tools that ingest claims data from the TPA’s reporting, normalize it against industry benchmarks, and produce projections with sensitivity analysis. No commercially available broker tool does this at scale for small group level funded.
Stop loss evaluation requires comparing terms across carriers. A broker marketing stop loss for a renewal needs to evaluate specific attachment points, aggregate corridors, laser provisions, terminal liability terms, and run-out provisions across multiple carrier quotes. The optimal structure depends on the group’s claims history, the presence of known high-cost claimants, and the employer’s risk tolerance. This evaluation is fundamentally actuarial work. The broker performing it in a spreadsheet is doing actuarial work without actuarial tools, which means the analysis is incomplete, the sensitivities are unexplored, and the recommendation is based on fewer variables than the decision warrants.
Renewal intelligence transforms the renewal conversation. A broker who can show the employer, at month eight, that the claims run rate is tracking 15 percent below expected, that no member is approaching the specific attachment point, and that the surplus projection is favorable is providing intelligence that justifies the level funded structure and builds employer confidence. A broker who can show at month eight that one member has generated $40,000 in claims and is trending toward the $50,000 specific attachment point, that a laser is likely at renewal, and that the employer should begin evaluating options for managing that exposure is providing advisory value that directly affects the employer’s financial outcome. Both analyses require tools that most brokers do not have.
Comparative benchmarking shows the employer how their plan performance compares to similar employers in their industry, geography, and size range. Benchmarking databases exist. Milliman maintains actuarial databases. The Health Care Cost Institute publishes utilization and spending data. Truven Health Analytics (now part of Merative, an IBM spinoff) provides employer health plan benchmarking. TPA databases contain aggregated claims data across their books of business. But brokers lack standardized tools to access this data and present it in client-facing formats. The benchmarking capability that would differentiate a broker’s advisory is locked inside organizations the broker cannot access or afford.
Multi-model analysis is the emerging requirement. For the employer who may benefit from level funded for full-time employees, ICHRA for a remote class, and a different configuration for part-time staff (LFP-14.06), the broker needs tools to compare the total cost and coverage outcomes across models for the same employer population. No current broker tool integrates level funded quoting, ICHRA contribution modeling, and hybrid model analysis in a single platform.
The Capability Gap and Its Consequences#
The gap between what level funded advisory requires and what broker tools provide produces two consequences.
Advisory quality suffers. The broker who compares level funded to fully insured using a manual spreadsheet without claims data analysis, stop loss evaluation methodology, or benchmarking data is providing an incomplete comparison. The employer’s decision is based on incomplete information. If the employer selects level funded and the outcome is poor, the advisory quality is in question (LFP-14.03). The technology gap becomes an E&O exposure multiplier: the broker who lacks the tools to perform rigorous analysis but recommends the product anyway has created a gap between the advisory standard the product requires and the advisory standard the broker delivered.
Market adoption is constrained. Brokers who lack the analytical tools to present level funded competently avoid presenting it. They stick with fully insured because the comparison is simpler, the risk to the employer is lower, the E&O exposure is narrower, and the analytical demands are within their existing capability. The technology gap reinforces the gatekeeper constraint identified in 14.01: brokers do not present level funded because they cannot present it well, and they cannot present it well because they lack the tools.
The Broker Gap Is Distinct From the TPA Gap#
The TPA technology gap (LFP-13.05) constrains plan administration and cost management capability. A TPA with poor technology cannot process claims efficiently, manage stop loss coordination, or provide member navigation tools. The broker technology gap constrains advisory quality and distribution effectiveness. A broker with poor analytical tools cannot evaluate claims data, compare stop loss structures, or present level funded competitively against fully insured alternatives.
The gaps are related. The TPA’s poor reporting means the broker has poor data to work with. A broker with excellent analytical tools who receives monthly claims reports from the TPA in PDF format with no underlying data file cannot perform the analysis the tools are designed to support. Conversely, a broker with no analytical tools who receives excellent data feeds from the TPA has data without the capacity to use it.
Both gaps must close for level funded to reach its market potential. The product architecture in Series 15 addresses both: 15.07 specifies the TPA technology requirements and 15.08 specifies the broker tools the tiered model must provide. The TPA that provides brokers with analytical tools, including plan-level analytics dashboards, stop loss evaluation frameworks, benchmarking data, and multi-model comparison capabilities, removes the technology barrier from the distribution channel. The investment in broker-facing technology is an investment in distribution capacity. It is the mechanism by which the TPA’s product reaches the employers who need it through the brokers who serve them.
How this article connects to others in Blue Gray Matters.
Sources cited in this article.
- "AgencyBloc Reports Record-Breaking Growth in 2024." AgencyBloc, 27 Jan. 2025, www.agencybloc.com/about-us/agencybloc-reports-recordbreaking-growth-in-2024/.
- "Benefit Administration Software Market Size and Forecast (2025-2030)." Mordor Intelligence, 2025, www.mordorintelligence.com/industry-reports/benefit-administration-software-market.
- "Benefits Administration Software Market Size, Share and Trends Analysis." Global Growth Insights, 2025, www.globalgrowthinsights.com/market-reports/benefits-administration-software-market-105932.
- "Breaking Down Health Plan Fees." HealthTechStack, 19 Feb. 2025, www.healthtechstack.io/p/breaking-down-health-plan-fees.
- "Employee Navigator's Acquisition of Ease." OutSail, Oct. 2024.
- "Top 10 Benefits Administration Software Vendors, Market Size and Forecast 2024-2029." Apps Run the World, Sept. 2025, www.appsruntheworld.com/top-10-hcm-software-vendors-in-benefit-administration-market-segment/.