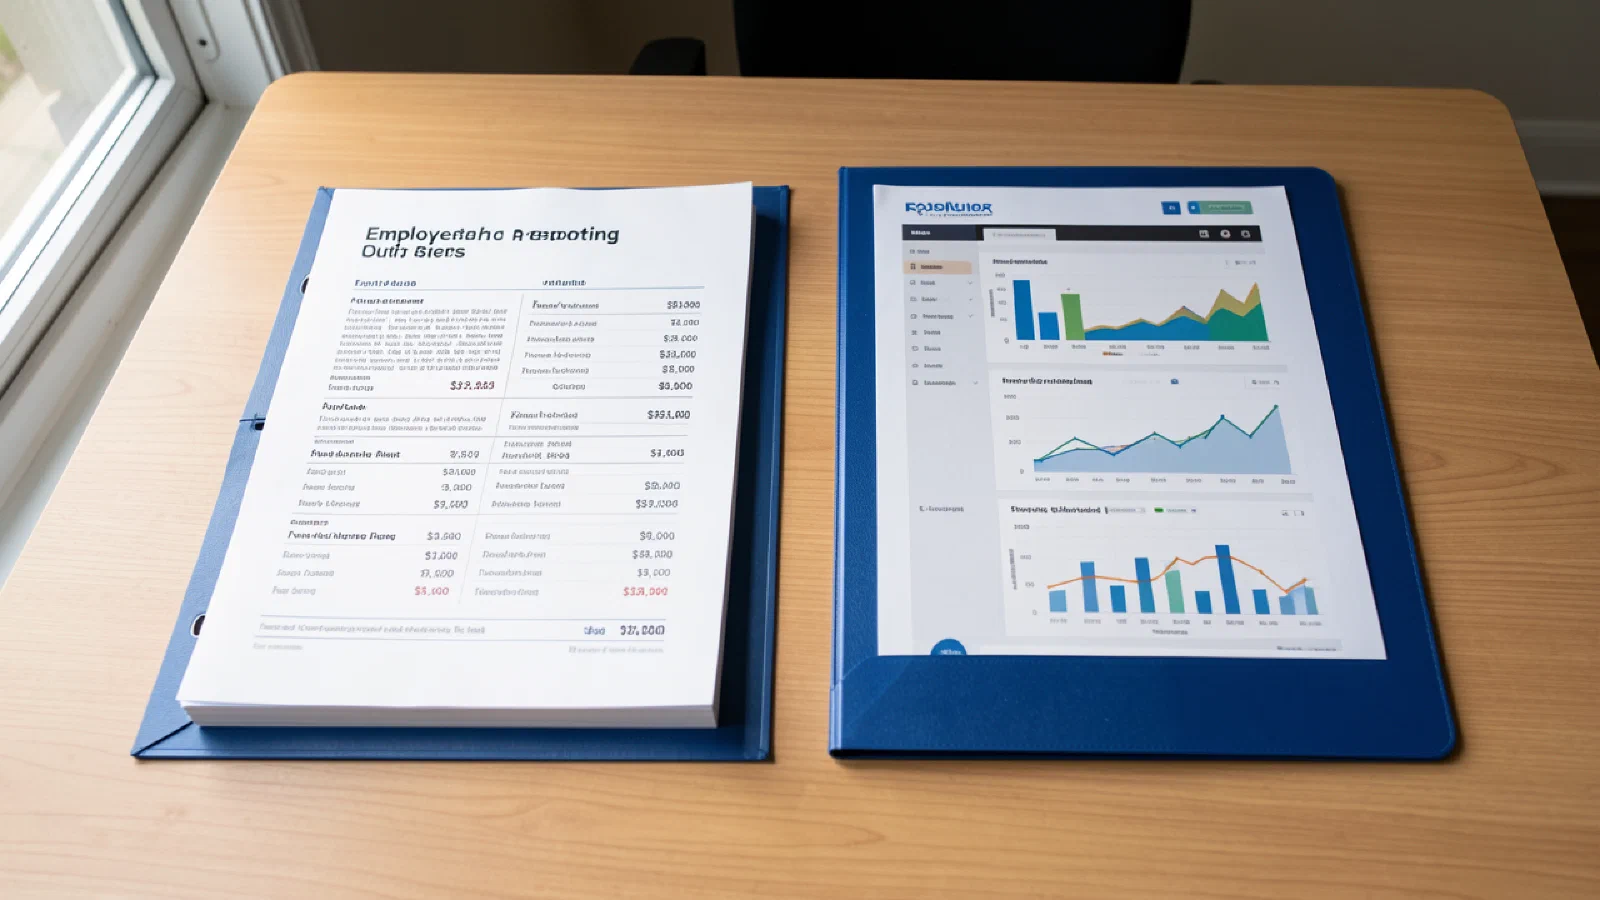
Employer Reporting: What Data Actually Reveals and What Most TPAs Hide Behind PDFs
Employer reporting is where the level funded value proposition either materializes or fails. The structural case for level funded includes transparency: the employer sees claims data, understands cost drivers, and can make informed decisions. But transparency requires reporting that delivers actionable insight. A monthly PDF with aggregate numbers is not transparency. An interactive dashboard with drill-down by member, provider, service category, and time period is transparency. The gap between what level funded promises and what most TPAs deliver is measured in the quality of employer reporting.
What Reporting Should Contain#
Monthly and quarterly reporting should provide a comprehensive view of plan performance.
Claims summary reports show total claims paid, claims by category (medical, pharmacy, ancillary), and comparison to expected claims. The employer should see whether the plan is running above or below budget and by how much. Trend analysis shows how claims are changing month over month and year over year. A spike in claims should be visible immediately, not discovered at renewal.
Utilization reports show what services members are using: emergency room visits, specialist consultations, hospitalizations, imaging, laboratory, physical therapy, and behavioral health. Utilization data reveals patterns. High emergency room utilization may indicate access problems or member education needs. High imaging utilization may indicate overuse that plan design or utilization management could address.
Provider cost reports show where money is going at the provider level. Which hospitals are members using? At what cost? Which physician groups generate the most claims? Are there high-cost outliers that alternative providers could address? Provider cost data enables steering strategies, center of excellence programs, and network optimization.
Pharmacy reports show prescription drug utilization and cost. Which drugs are most prescribed? Which are most expensive? Are members using generic alternatives where available? Are specialty drugs driving costs? Pharmacy data enables formulary management, prior authorization refinement, and manufacturer assistance program utilization.
Large claimant reports identify members with claims above a threshold, typically $25,000 or $50,000 annually. Large claimants drive plan cost. Understanding who they are, what conditions they have, and what trajectory their costs follow enables case management, disease management, and stop loss accumulator monitoring. Large claimant data is sensitive and must be handled appropriately under HIPAA, but the employer sponsor has a legitimate need to understand aggregate large claimant impact.
Stop loss accumulator status shows where individual members stand relative to specific attachment points and where aggregate claims stand relative to the aggregate attachment. The employer should know if a member is approaching the specific threshold and will trigger stop loss recovery. The employer should know if aggregate claims are trending toward the corridor.
Financial summary reports show the claims fund status: contributions in, claims paid, administrative costs, stop loss premium, and current balance. The employer should understand their financial position at any point in the plan year, not only at year-end reconciliation.
The PDF Problem#
Many TPAs deliver reporting as static PDF documents. A monthly PDF might contain five to ten pages of summary data: total claims, claims by category, a utilization chart, and a financial summary. The PDF is better than nothing. It provides some visibility into plan performance. But it falls far short of what level funded transparency should deliver.
PDF reports cannot be manipulated. The employer cannot filter to see claims for a specific month, a specific service category, or a specific location. The employer cannot sort providers by cost to identify high-cost outliers. The employer cannot drill down from an aggregate number to the underlying claims. The employer receives the TPA’s summary and can take it or leave it.
PDF reports often lack detail. The TPA decides what to include. Aggregate numbers are safe: total claims paid, average cost per member. Specific data is risky: individual member costs, provider-level analysis, recovery performance. The TPA that does not want to reveal poor performance hides behind aggregate summaries that do not expose problems.
PDF reports are difficult to track over time. The employer receives a PDF each month. Building a longitudinal view of plan performance requires manually extracting data from each PDF and compiling it elsewhere. Most employers do not do this. They look at each month’s report in isolation and have no clear view of trend.
The employer who receives only PDF reporting does not have the transparency that level funded promises. They have visibility into what the TPA chooses to show, formatted in a way that prevents analysis.
What Good Reporting Looks Like#
High-performing TPAs provide interactive reporting that enables employer analysis.
Dashboard access gives the employer a login to a reporting platform where they can view data on demand. The dashboard is not a static snapshot; it updates as claims are processed. The employer can check plan status at any time, not only when the TPA sends a report.
Drill-down capability allows the employer to move from summary to detail. Seeing that claims are running 15% above expected is informative. Drilling down to see that the variance is driven by three large claimants with cancer treatment is actionable. Drilling further to see which providers are treating those claimants and at what cost enables conversation with the broker or TPA about management strategies.
Filtering and sorting allow the employer to slice data as they need. Filter to see only pharmacy claims. Sort providers by total paid to identify outliers. Filter to a specific time period to understand a spike. The employer can ask their own questions rather than accepting the TPA’s predetermined summary.
Export capability allows the employer to extract data for their own analysis or to share with their broker. An employer who wants to compare TPA reporting to their own financial records can export and reconcile. A broker who wants to build a renewal analysis can export claims data rather than manually transcribing PDF figures.
Trend visualization shows patterns over time. Claims trajectory, utilization trends, cost per member trends, and seasonal patterns are visible as charts and graphs that update with each data refresh. The employer sees whether things are improving, stable, or deteriorating.
Benchmark comparison shows how this plan compares to similar plans. Is the cost per member above or below the TPA’s book average? Is the emergency room utilization rate high or normal? Benchmarking provides context that raw numbers lack.
The Broker’s Role in Reporting Quality#
The broker should evaluate TPA reporting capability before placing business and should use reporting actively throughout the relationship.
Before placement, the broker should request sample reports and dashboard demonstrations. What does the employer reporting look like? Can the broker access the same data? What drill-down and filtering capabilities exist? A broker who places business without evaluating reporting capability is not serving the employer.
During the relationship, the broker should review reporting regularly and discuss findings with the employer. What does the claims trend show? Are there high-cost providers to address? Is the stop loss accumulator on track? The broker who reviews reports quarterly with the employer adds value. The broker who ignores reports until renewal is missing the point of level funded.
At renewal, the broker should use reporting data to prepare for negotiation. Claims experience data drives the renewal discussion. Large claimant data affects stop loss terms. The broker who has been tracking this data throughout the year is prepared. The broker who requests data at renewal is scrambling.
The broker can also push for reporting improvements. If the TPA’s reporting is inadequate, the broker should raise it. The broker relationship matters to the TPA. A broker who insists on better reporting for their clients can influence TPA behavior. A broker who accepts whatever the TPA provides perpetuates poor reporting standards.
Why Reporting Quality Varies#
Reporting quality varies because TPAs have different capabilities and different incentives.
Capability varies with technology investment. Interactive dashboards require modern data infrastructure: data warehouses, business intelligence tools, and user interface development. TPAs that have invested in technology can deliver interactive reporting. TPAs running on legacy systems with manual processes cannot. Technology investment is expensive, and many small TPAs have not made it.
Incentives may not favor transparency. A TPA that is performing poorly has an incentive to obscure that performance. Aggregate summaries hide problems that detailed data would reveal. PDF reports prevent employer analysis that might expose deficiencies. A TPA that knows the employer will not dig deeper has no incentive to make digging possible.
Market pressure is weak because most employers do not demand better reporting. They accept what they receive because they do not know what good reporting looks like. Employers who have only seen PDF summaries do not realize that interactive dashboards are possible. Without market pressure, TPAs have no reason to invest in reporting improvement.
The employer who demands reporting quality and evaluates TPAs on this dimension creates pressure for improvement. The broker who makes reporting quality a placement criterion amplifies that pressure. The market will improve when buyers insist on it.
The Connection Between Reporting and Plan Management#
Reporting quality determines whether the employer can actually manage their health plan or merely observe it.
An employer with good reporting can identify cost drivers and address them. They see that emergency room utilization is high and implement telemedicine and urgent care steering. They see that a specific specialty is driving costs and evaluate center of excellence options. They see that certain drugs are expensive and work with the PBM on formulary alternatives. Good reporting enables action.
An employer with poor reporting observes aggregate trends without understanding causes. They know claims are up but not why. They cannot identify the interventions that would reduce costs because they cannot see where costs are coming from. They accept renewal increases without understanding whether those increases were avoidable.
The broker’s value depends partly on reporting quality. A broker who can analyze detailed claims data provides strategic advice. A broker who can only summarize PDF reports provides limited value. The broker working with a TPA that provides good reporting can demonstrate value through analysis. The broker working with a TPA that provides poor reporting struggles to differentiate.
Reporting quality should be a selection criterion. When evaluating TPAs, the employer and broker should request reporting samples and demonstrations. What data is available? In what format? With what frequency? With what drill-down capability? The answers reveal whether the TPA treats reporting as a strategic function or an afterthought.
The employer should set reporting expectations in the contract. Specify the reports required, the frequency of delivery, the format (interactive vs. static), and the access method (dashboard login vs. emailed PDF). Contractual requirements create accountability. A TPA that commits to specific reporting standards must deliver or face contractual consequences.
The Privacy Dimension#
Employer reporting involves claims data that implicates member privacy. The employer must receive data in a manner that complies with HIPAA and serves legitimate plan management purposes.
The plan sponsor receives claims data as part of plan administration. HIPAA permits this disclosure to the extent the plan document provides for it and appropriate firewalls are in place. The employer cannot use claims data for employment decisions unrelated to plan administration. The data is for managing the plan, not for managing employees.
Large claimant reporting requires particular care. Identifying that a specific member has cancer or is pregnant implicates that member’s privacy. Reporting may anonymize large claimants (Member A, Member B) or aggregate them by condition category without individual identification. The appropriate approach depends on group size, plan document provisions, and employer comfort.
The TPA’s reporting design should balance transparency with privacy. The employer needs to understand cost drivers without necessarily identifying which specific employee has which condition. Good reporting design provides actionable insight at the appropriate level of aggregation.
How this article connects to others in Blue Gray Matters.
Sources cited in this article.
- Employee Benefit Research Institute. "Health Care Cost and Coverage Issue Briefs." EBRI, www.ebri.org.
- United States Department of Labor, Employee Benefits Security Administration. "Reporting and Disclosure Guide for Employee Benefit Plans." DOL, www.dol.gov/agencies/ebsa/employers-and-advisers/plan-administration-and-compliance/reporting-and-disclosure.